

Crypto Crypto Technical Analysis for Beginners:
Getting anywhere in the crypto market takes more than luck or a good gut feeling. You need real data to work with. Fundamental analysis helps you decide which coin to buy, but crypto technical analysis helps you decide when to buy and when to sell. Chart reading is the backbone of solid trading. It lets you look back at past price action, spot patterns, and estimate where the price may head next, with better odds than guessing.
If you’re new, a chart crowded with candlesticks, trendlines, and indicators can look intimidating. Try to think of it differently. Technical analysis is really just the study of market psychology, recorded as it happens. In this guide to crypto technical analysis for beginners, we’ll go through candlestick patterns, support and resistance zones, the core indicators, and practical steps for reading charts with confidence.
What Is Technical Analysis in Crypto?
Technical analysis (TA) is a method for judging investments and finding trading opportunities by studying statistical trends from market activity, mainly price movement and trading volume.
Fundamental analysis looks at a project’s technology, whitepaper, team, and adoption. Technical analysis skips all of that and focuses on market psychology as it shows up on a price chart.
The Core Assumptions of Technical Analysis
- The market discounts everything: Fundamental news, regulatory changes, and investor emotions are all assumed to be baked into the current price already.
- Prices move in trends: Assets rarely wander at random. Most of the time they follow an upward, downward, or sideways trend over a given timeframe.
- History tends to repeat itself: Human psychology doesn’t change much. Traders often react in similar ways when similar conditions return, which is why recognizable chart patterns keep appearing.
Understanding Candlestick Charts
Candlestick charts are the most popular way to view prices in crypto trading. They began in 18th-century Japan, where they were used to track rice prices. Each candlestick shows four key prices within a chosen timeframe, such as 15 minutes, 1 hour, or 1 day:
- Open (O): The price at the start of the timeframe.
- High (H): The highest price reached during that period.
- Low (L): The lowest price reached during that period.
- Close (C): The price at the end of the timeframe.
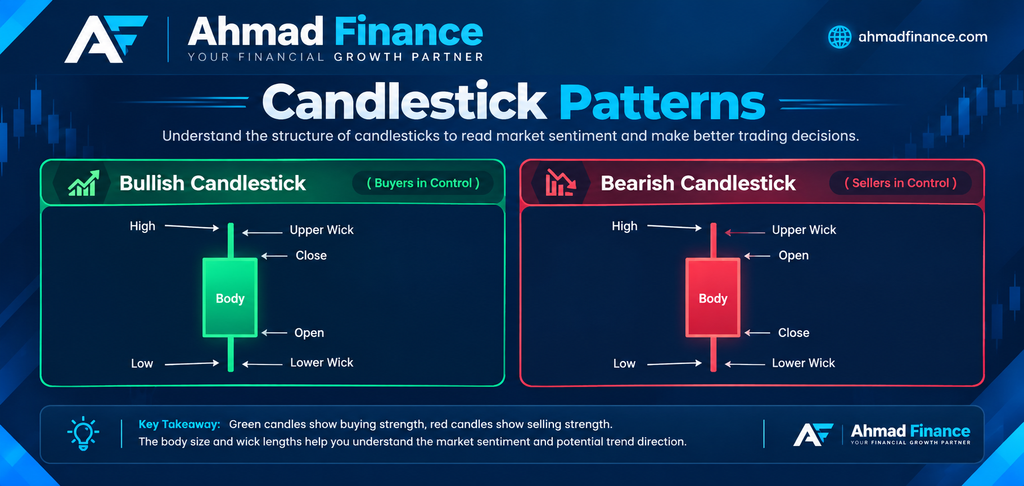
- Green (bullish) candlestick: The price closed higher than it opened, which points to buying pressure.
- Red (bearish) candlestick: The price closed lower than it opened, which points to selling pressure.
- Wicks (shadows): The thin lines sticking out above and below the thick body mark the highest and lowest prices reached during that period.
Identifying Market Trends and Trendlines
Before you touch any complex indicator, you need to know which way the market is heading overall. This is a basic step in crypto technical analysis for beginners, and it matters because trading in the same direction as the broader trend makes your trades far more efficient.
Types of Market Trends
- Uptrend (bullish market): The chart makes a series of higher highs (HH) and higher lows (HL). Buyers are in control.
- Downtrend (bearish market): The chart makes a series of lower highs (LH) and lower lows (LL). Sellers are in control.
- Sideways trend (consolidation): The price bounces around inside a flat range and doesn’t settle on a direction.
Support and Resistance Levels
Support and resistance are horizontal price boundaries where the market often turns around, because a large amount of buying or selling tends to pile up at those levels.
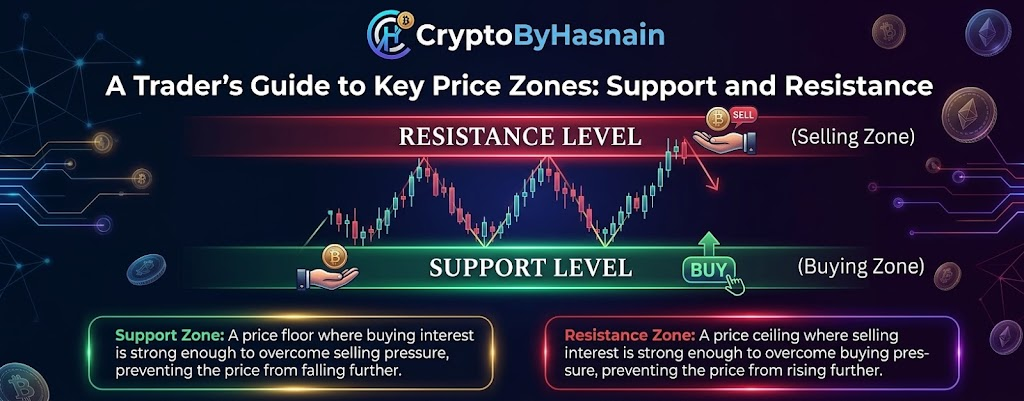
- Support zone: A price floor where buyers are strong enough to outweigh sellers, so the price stops falling.
- Resistance zone: A price ceiling where sellers are strong enough to outweigh buyers, so the price stops rising.
- Role reversal principle: When a key resistance level is broken decisively on high volume, it often turns into a new support level the next time the price comes back to test it.
Essential Technical Indicators Every Beginner Should Know
Indicators are calculations built from price, volume, or open interest. They help you confirm a trend, gauge momentum, and spot possible reversals. For anyone learning crypto technical analysis for beginners, these four are the best place to start.
1. Moving Averages (MA)
A moving average smooths out noisy price data into one continuous line, so the overall direction of the trend is easier to see.
- Simple moving average (SMA): The average price of an asset over a fixed number of periods, such as the 50-day or 200-day SMA.
- Exponential moving average (EMA): Puts more weight on recent prices, so it reacts faster to short-term changes.
- Golden cross: A classic bullish signal. It appears when a short-term average (say, the 50 EMA) moves above a long-term one (say, the 200 EMA).
- Death cross: The bearish opposite. It appears when the short-term average drops below the long-term one.
2. Relative Strength Index (RSI)
The RSI is a momentum oscillator. It measures how fast and how far the price has moved recently, on a scale from 0 to 100.
| RSI value | Market condition | What it usually means |
|---|---|---|
| Above 70 | Overbought | The asset may be overvalued, and a pullback or reversal is possible. |
| Below 30 | Oversold | The asset may be undervalued, and a rebound could be on the way. |
| Around 50 | Neutral | The market is balanced, with no clear lean in either direction. |
Pro tip: An overbought reading doesn’t mean you should short right away, and an oversold reading isn’t an instant buy signal. In a strong trend, an asset can stay overbought or oversold for a surprisingly long time.
3. Moving Average Convergence Divergence (MACD)
The MACD is a trend-following momentum indicator. It shows how two moving averages of a price relate to each other.
- MACD line: The 12-period EMA minus the 26-period EMA.
- Signal line: A 9-period EMA of the MACD line.
- Bullish crossover: The MACD line crosses above the signal line.
- Bearish crossover: The MACD line crosses below the signal line.
4. Volume Analysis
Volume is the total amount of an asset traded in a given timeframe. Think of it as the fuel that confirms whether a price move is real.
- High-volume breakout: When the price breaks above resistance and volume is heavy, it shows strong conviction, and the trend is likely to continue.
- Low-volume breakout: A move on thin volume is often a false breakout (a fakeout), and it can reverse quickly.
Key Reversal Chart Patterns
Structural chart patterns can help you anticipate a change in trend before it fully plays out.
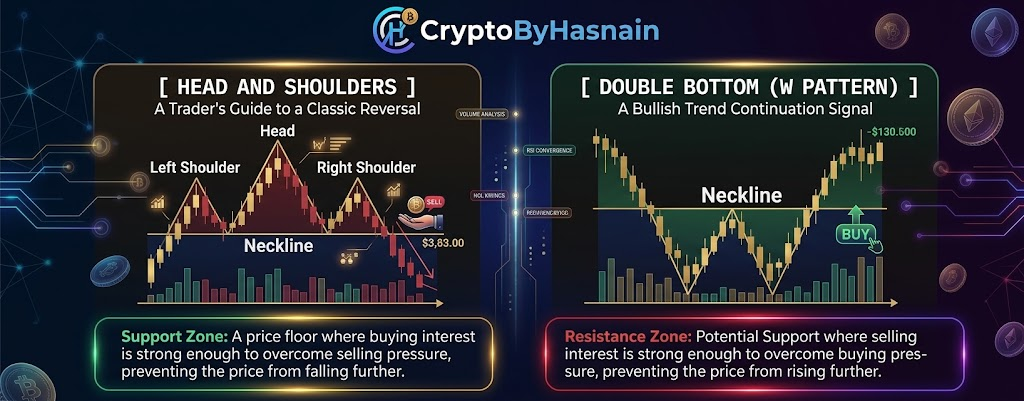
1. Head and Shoulders (Bearish Reversal)
- Structure: The pattern has three peaks. The middle one, the head, is the tallest, and it sits between two lower peaks, the shoulders. All three rest on a shared baseline called the neckline.
- Signal: When the price breaks clearly below the neckline, it hints that an uptrend may be turning into a downtrend.
2. Double Bottom / “W” Pattern (Bullish Reversal)
- Structure: Two lows form one after the other at roughly the same price, and together they look like the letter “W”.
- Signal: When the price breaks above the peak in the middle, the bullish reversal is confirmed, and it shows that buyers are taking over.
Step-by-Step Framework for Executing Technical Trades
If you want to apply crypto technical analysis for beginners in a consistent way, here’s a workflow you can follow for every trade:
- Start with higher timeframes: Open the 1-day or 4-hour chart first. This shows you the overall trend and the major support and resistance levels.
- Switch to lower timeframes: Then move down to the 1-hour or 15-minute chart to fine-tune exactly where you’ll enter.
- Look for indicator confluence: Don’t enter a trade because of one indicator alone. Wait until several signals agree, for example a bounce off a key support level, an oversold RSI, and a bullish MACD crossover, all at the same time.
- Calculate your risk-to-reward ratio (RRR): Aim for at least 1:2. In other words, your profit target should be twice the size of what you’re risking.
- Place orders with firm limits: Before you execute, set your entry limit order along with your automatic stop-loss and take-profit levels.
Common Technical Analysis Pitfalls to Avoid
- Overcomplicating your charts (indicator overload): A chart packed with dozens of indicators leads to “analysis paralysis.” Stick with two or three that complement each other, plus clean support and resistance levels.
- Ignoring the broader market: Most altcoins rarely move against Bitcoin’s larger trend. Check where Bitcoin is heading before you trade smaller coins.
- Bending the chart to fit your bias: Don’t hunt for patterns that confirm what you’re hoping will happen. Look at the data as it actually appears.
- Trading without stop-losses: Technical patterns fail all the time because of surprise news or sudden liquidations. Protect your balance with a stop-loss every time.
Conclusion
Getting good at crypto technical analysis for beginners takes practice, careful observation, and emotional discipline. TA isn’t a crystal ball that promises what happens next. It’s a tool for estimating probabilities so you can manage market risk better.
Begin by studying live charts without risking real money, which is called paper trading. Draw key trendlines and watch how the price behaves around major support and resistance zones. Stay consistent, and chart reading will become one of the most useful skills in your crypto trading toolkit.
Disclaimer: Content published on Cryptobyhasnain is for informational and educational purposes only and should not be construed as financial advice. Always do your own research before making any investment decisions.